Green heat map
Read the green before you get there.
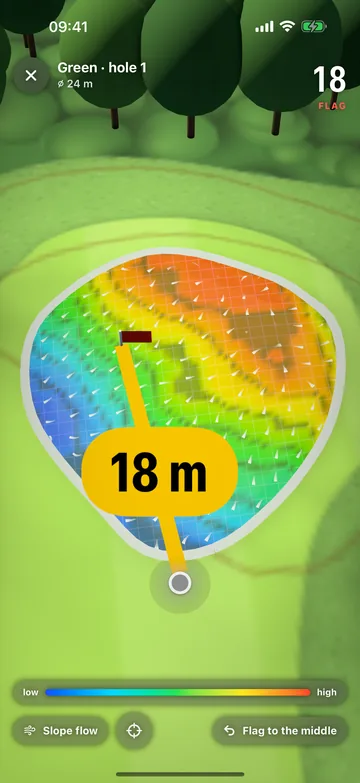
A green heat map colors the green by its height: blue is low, red is high, with arrows pointing the way it falls. DeepSwing shows it on more than 12,000 courses, in 3D on the iPhone and on your wrist on the Apple Watch. The heights come from public laser scans of the terrain, so from the fairway you can already see which side of the pin you want to be on. Free on iPhone.

 Coming soon Google Play
Free on iPhone, no subscription, no round limit. Apple Watch: your first round is free. Coming to Android
- 1 mheight grid on the green
- 5 cmbetween two contour lines
- 3Don iPhone
- $0on iPhone

How a round works
From the first tee
to the scorecard.
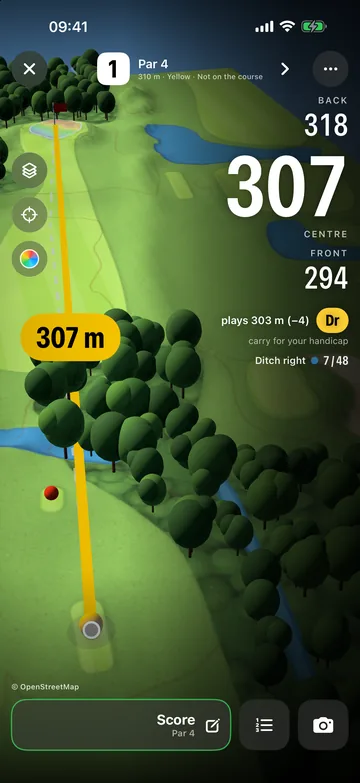
Scroll through a par 4: distances, green and score, the way you see them on the course.
-
01
Find your course.
Nearby via GPS, by name or on the globe. Then 9 or 18 holes.
-
02
Front, middle, back.
The distance to the green in big numbers, plus bunkers, water and how far you have to carry.
-
03
See where the green breaks.
The green heat map colors the heights from blue to red, arrows show the slope.
-
04
Score and handicap.
A scorecard for up to four players, Stableford and match play, your handicap index under the WHS.
Colors
Blue is low, red is high.
Every spot on the green gets its color from its height: the lowest point in blue, then green and yellow up to the highest in red. Darker lines sit at every five centimeters of height, like contour lines on a hiking map. At the top you see how much the whole green falls and how steep it is on average.
- Color scale from low to high
- Contour lines every 5 cm
- Height difference and slope in percent
Rules of Golf
Off in competition, on in practice.
Under Rule 4.3 of the Rules of Golf, green maps in competition must be small in scale (1:480 at most), and no device may interpret the slope for you. So the green heat map is for practice and casual rounds. In a competition, use the plain distances only, if the committee allows them.
Slope
Arrows show where the ball will go.
Turn on the slope and small arrows run across the green, pointing downhill the way water would flow. You spot ridges, hollows and the side a putt breaks from. Tap the green where the pin is today and the distance counts to that spot.
- Slope as arrows
- Set today's pin position
- Distance to the pin
Data
From laser scans, not guesswork.
The heights come from public digital terrain models that survey offices and agencies build by scanning the ground from the air with lasers. In Germany, for most courses in the US and across much of Europe, their grid is one to two meters, fine enough for the shape of a green. Where only coarser data exists, the heat map shows the general tilt and no single undulations.
- Laser-scan terrain models (LiDAR)
- 1 to 2 m grid where available
- Coarse data shows only the tilt
Apple Watch
The green on your wrist.
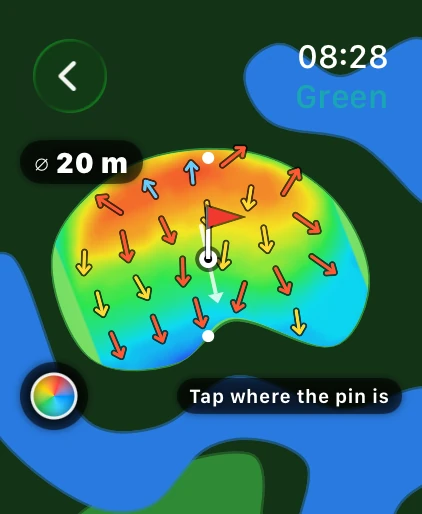
On the Apple Watch, one tap opens the green as a heat map with slope arrows, its diameter and your distance. As you get closer, the heat map also shows on the main page's map. Set the pin there with a tap.
- Heat map and arrows on the watch
- Diameter of the green
- Tap to set the pin
How it works
- 1
Pick a course and hole
Start a round or just open a hole on the map.
- 2
Tap the green
It opens in 3D with colors, contour lines and, if you like, slope arrows.
- 3
Set the pin
Tap where the pin is today. Distance and line count to that spot.
Questions, answered
What is a green heat map?
A map of the green that colors every spot by its height, usually from blue for low to red for high. Arrows or lines show which way the green falls. It does not replace reading the putt at the ball, but it shows the high and low sides at a glance.
Where does DeepSwing get the heights of the greens?
From public digital terrain models made by laser scanning from aircraft. DeepSwing cuts a height grid for every green out of them and lays it over the shape of the green from OpenStreetMap.
How accurate is the heat map?
As accurate as the terrain model. With a one-meter grid you see ridges, tiers and the main tilt. It cannot show small breaks of a few centimeters, or greens rebuilt after the scan. Where only coarse data exists, it shows the general tilt.
Are green heat maps legal in tournaments?
Not in this form. Rule 4.3 limits green maps in competition to a small scale and bans devices that interpret the slope for you. Use the heat map in practice and casual rounds.
Does the green heat map cost anything?
It is free on the iPhone, like all of DeepSwing's golf GPS. On the Apple Watch your first round is free; after that the watch comes with every DeepSwing plan or the Apple Watch GPS plan.
New in DeepSwing 3.4
One app. Three areas.
- AI CoachUnderstand your swing.Film your swing and the AI shows your Swing Score, 20+ checks, swing plane and clubhead speed in seconds. Plus the one drill that fixes your biggest fault.7-day free trial
- Launch MonitorMeasure every shot.Put your iPhone on a tripod and hit real balls: ball speed, launch angle, direction, carry and total for every shot. Then it flies on the range or on 12,000+ real courses.5 free shots every week
- Golf GPSPlay your course.Distances to the front, middle and back, bunkers and water, a 3D green heat map and a scorecard with handicap. On 12,000+ courses, on your Apple Watch too.Free on iPhone
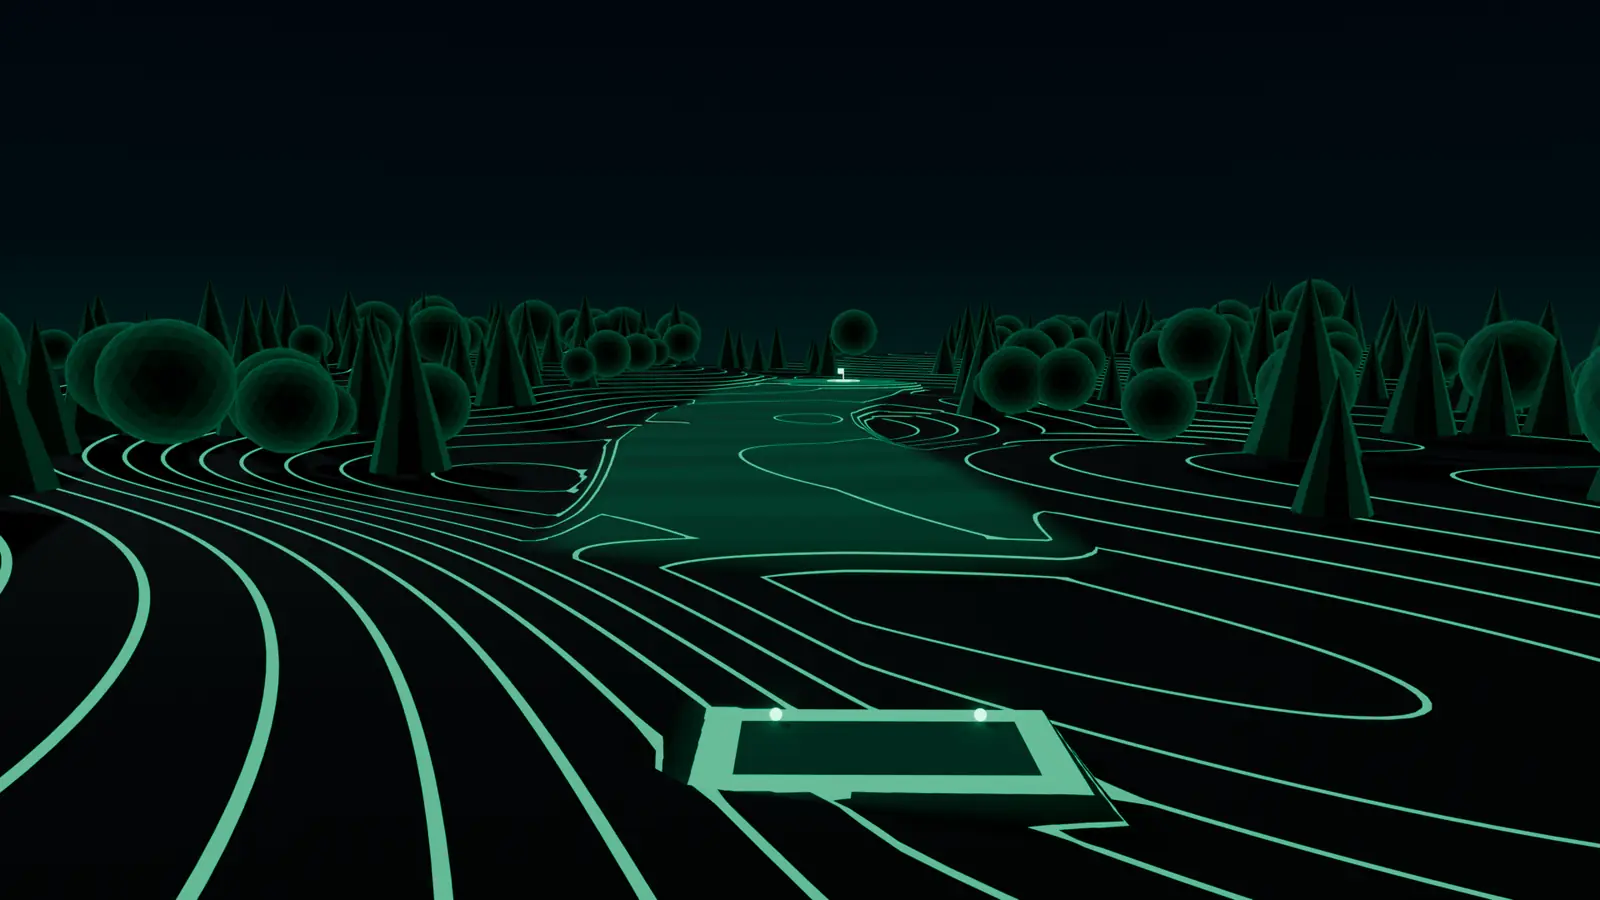
See the green before you putt.
Get DeepSwing and open the first green of your course in 3D.
Coming soon Google Play
DeepSwing is one app for all of it: AI swing analysis, a launch monitor and golf GPS. Golf GPS for Android and Wear OS is coming as an update to the same app.